You likely came here with one of two ideas about your current organization in your head:
-
It’s too chaotic; how do I convince people that we need more process?
-
It’s too bureaucratic; how do I convince people that we need less process?
This article is mostly about business processes. I will give you a visual model to enable a healthy debate about the question "how much process is enough?"
I’ll explain how necessary process grows with the size of the organization. This idea formed in 2020 in a conversation with my former colleague Jarrod Milshtein at Form Energy. Our team was less than 50 people. Five years later we’re 1000 employees and the model has proven itself.
Many people or teams are only trying to solve their own local problems. We want our teams to work at peak productivity. By the end you have three actionable tools to identify a good process.
How much process is enough? The short answer: slightly more than feels comfortable. Here’s why.
The Framework
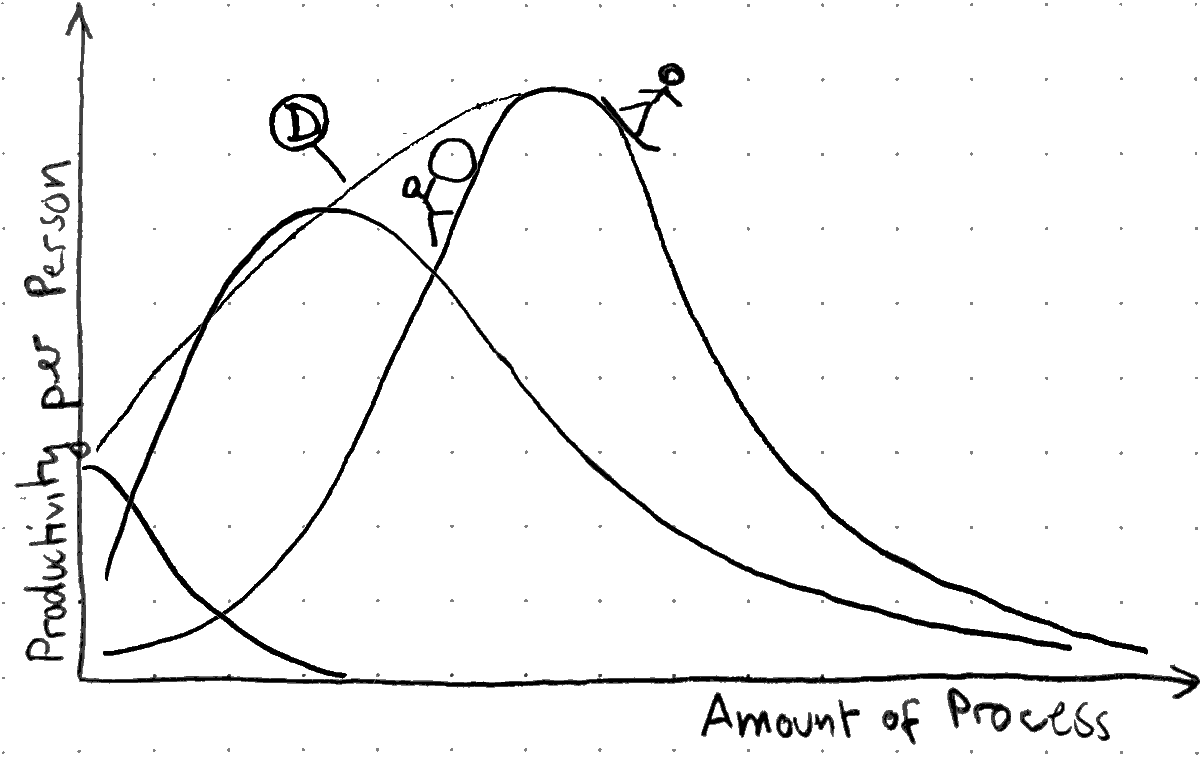
The following sections use a simple diagram made up of three parts.
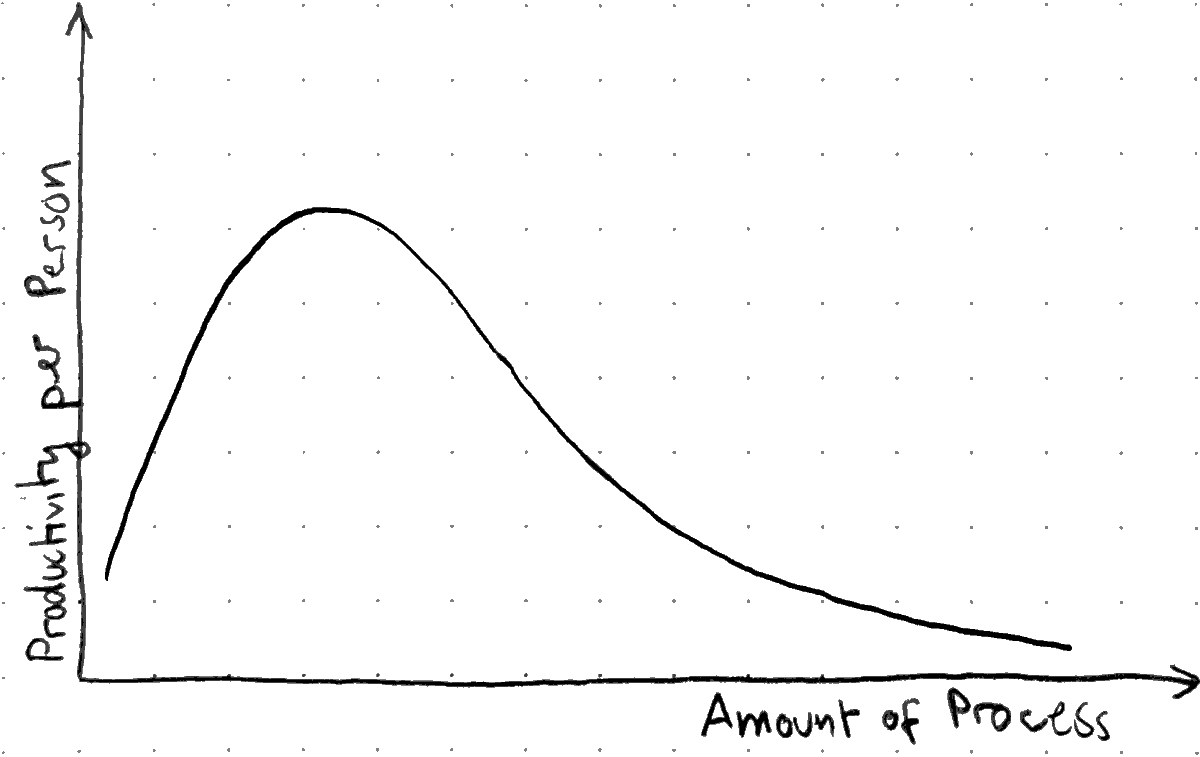
- Horizontal axis: The amount of process
-
None on the left and a detailed process for everything on the right. The axis has no upper bound. You can always add another process layer to control existing processes.
- Vertical axis: Productivity per person
-
No productivity at the bottom and more as we go up. This axis is also unlimited. We can always increase the amount of value that we generate for the team.
- The line represents the average productivity across the organization
-
Individuals sit somewhere above or below this line. The goal is to find the sweet spot for the organization as a whole. The left skewed shape is consistent with the Ringelmann Effect (1913): Individual effort and output drop as group size grows. This is due to coordination loss and motivation diffusion.
An Organization’s Life-Cycle
Let’s look at the life-cycle of an organization in this framework. From its birth to becoming a large company. No organization starts large. It always starts small.
There are two special cases where this is not true: splitting or merging organizations. It fits well within this mental model. I might write about this in another article.
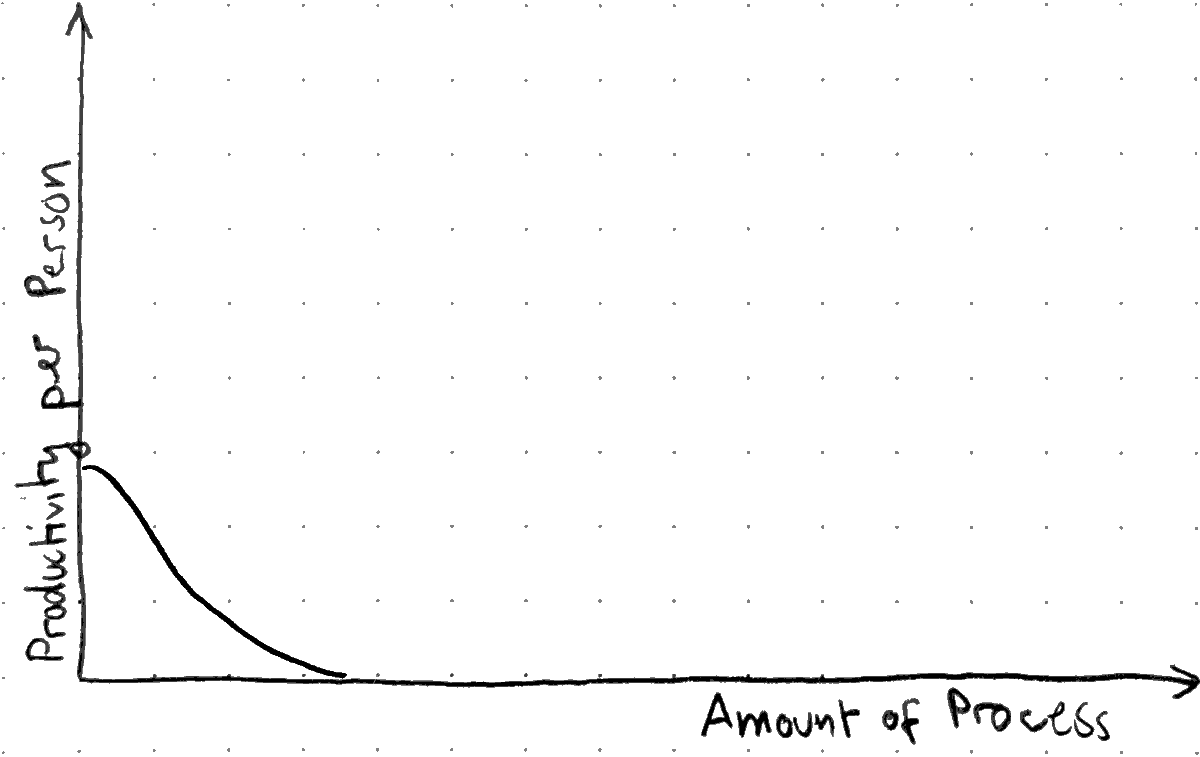
The Startup: Any Process Will Slow You Down
When a company is born there is only an idea and the people that want to turn it into reality.
The founders have to cover a lot of range per person. Everyone knows what the others are working on. You want to build, measure, learn fast and chaos is part of it. Any process that doesn’t accelerate learning is waste.
The Scaleup: Beginning to Grow
More people join the organization. Growing teams naturally specialize more. You form new teams and reorganize when needed. Communication paths grow quadratically with team size as n(n-1)/2 (Brooks' Law). A team of 10 has 45 channels; a team of 50 has 1225.
Process exists to tame this explosion.
People can focus on fewer things and be more productive. Increasingly, you have to actively find, share, and store information. Good process reduces the cognitive load; bad processes increase the cognitive load as you now track your work and a process.
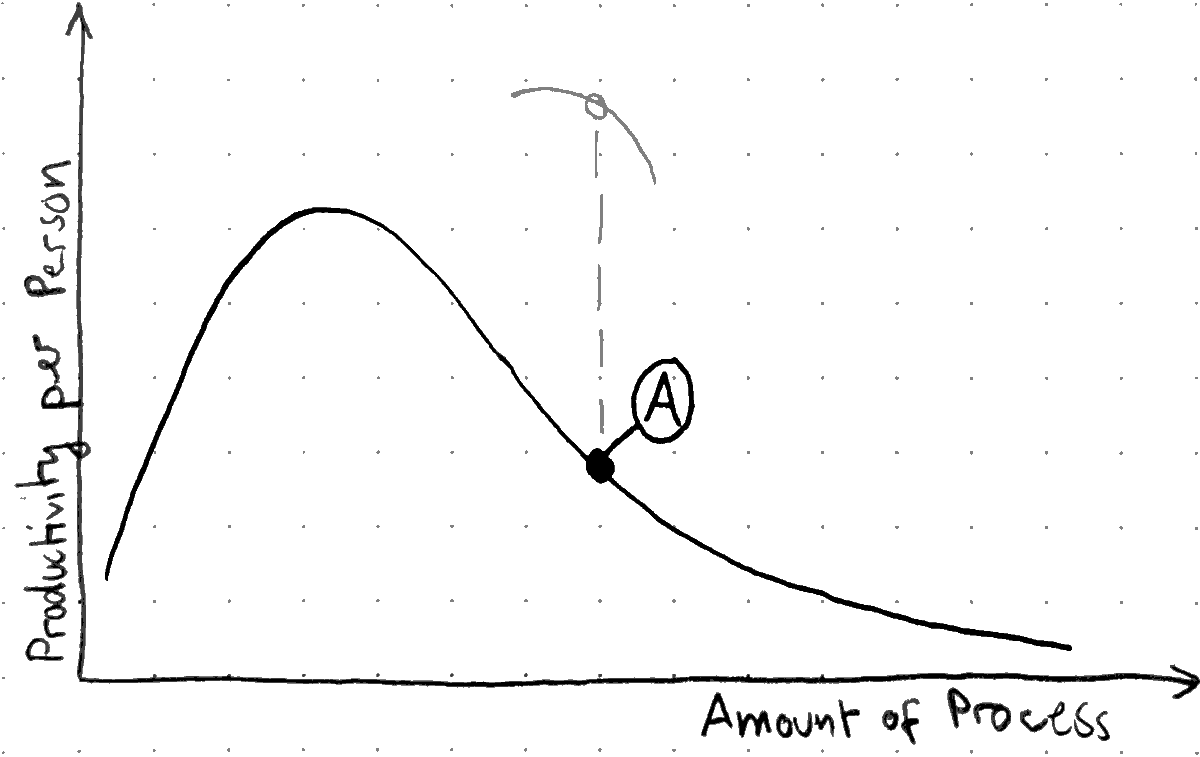
One risk at this stage: you hire senior people that bring experience but also their favorite processes with them. These processes worked for a different team size and culture. A best practice can cause a lot of friction if they apply them blindly (see Ⓐ in the figure above).
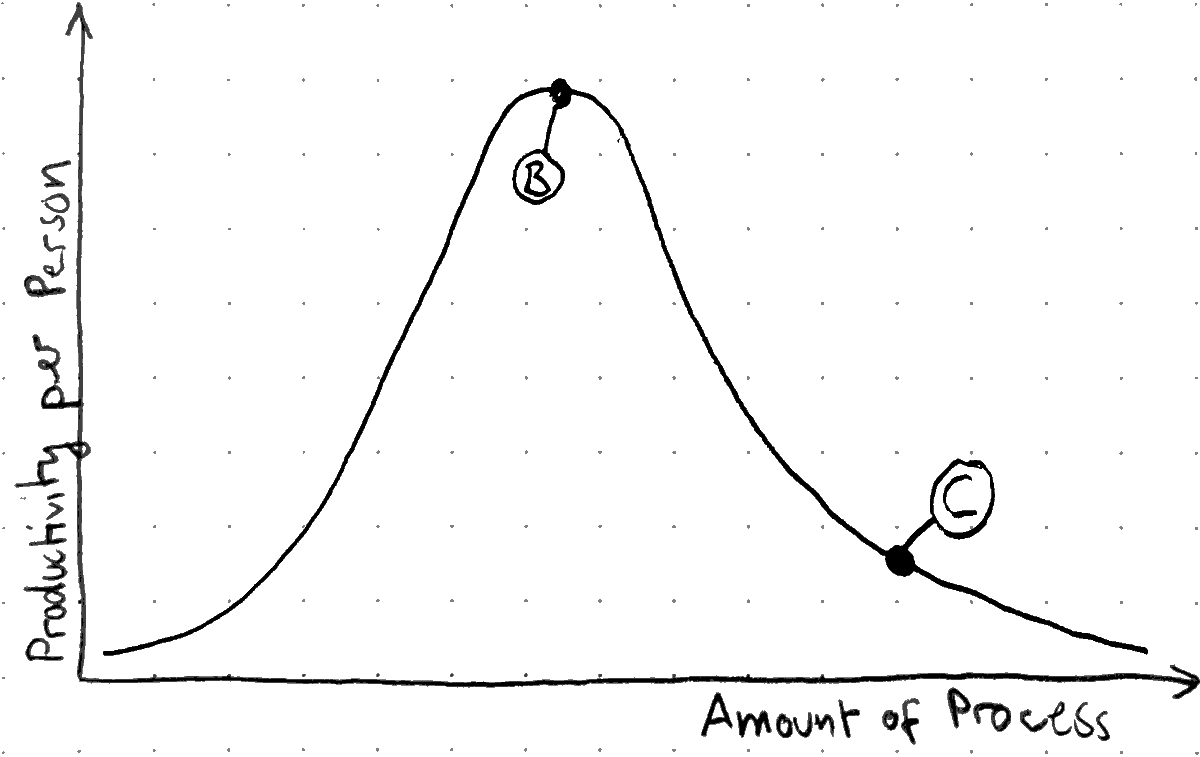
The Big Company: More Efficiency Through Process
Any team over 1000 people has many specialized functions and roles. There is now a clear sweet spot Ⓑ.
Hamel and Zanini argue in Humanocracy that bureaucracy costs the US economy $3 trillion annually. They developed the Bureaucratic Mass Index survey that allows you to estimate how bureaucratic your organization is.
Often, process after process is added to address problems in existing processes. Existing ones are not reviewed and never reduced or combined. Leadership might even lose trust in the employees because they are too far away in the org structure. A BCG Study put this into numbers: Procedures grew between 50% and 350% over 15 years across companies.
Over time that adds up: Many big companies rest far to the right on the chart Ⓒ. You know you’ve drifted too far right when people spend more time documenting their work than doing it.
How to Stay Productive and Efficient
As you have seen, the peak is moving to the top and the right Ⓓ as the organization grows.
Don’t push the rock up the hill. What is a little missing process now will be very inefficient when you grow. Under-processing creates organizational and technical debt. And it compounds over time.
Instead: Surf down the wave. A little bit too much process today will be just enough soon. Imagine you just closed a large funding round and prepare to scale from 25 to 75 people fast. Think what process to add now before coordination waste hits.
But wait! Too much process is good? How much is enough?
Three Tests for Better Processes
There are many ways to approach process design. I want to share three tests that I have picked up over time.
-
The Complexity Test
-
The Load Test
-
The Flow Test
-
The Trust Test
If a process fails test 0: Kill it.
If it fails one of the rest: Rethink it.
If it fails two: Kill it.
0. The Complexity Test
Are you solving a complicated or a complex problem?
No process can fix a complex problem. You have to be Complexity Conscious as Aaron Dignan writes in Brave New Work:
Unlike complicated problems, complex problems cannot be solved, only managed. They cannot be controlled, only nudged.
- Complicated Examples
-
-
An airplane
-
The tax code
-
A deployment pipeline
-
- Complex Examples
-
-
The weather
-
Genetics
-
Team morale after a layoff
-
It’s our human nature to try to turn complex into complicated. But be conscious about the situations where we should just accept the complexity.
1. The Load Test
Does this process increase or reduce the cognitive load for people doing the actual work?
If it adds load and doesn’t remove load elsewhere, don’t implement it. This concept is rooted in Team Topologies and their cognitive load framing.
2. The Flow Test
What information do I need to know, and what do I need to share?[1]
If you keep asking for the same information over and over and then wait for it, that’s a missing process. If nobody needs the outcome, that’s pure waste. You want your process to flow and create value without stopping.
The I-framing is intentional. You can only fix what you control. Too often we’re trying to solve other people’s problems or just take bureaucracy around us for granted.
Add a review or expiry date to every process and policy. Information needs change over time. If you don’t improve your process continuously, it will fall apart.
3. The Trust Test
Does this process assume people want to do a good job? Or is it in place because leadership loses trust in their employees?
You are people positive in the first case. This is a second concept from Brave New Work. People want to do a good job, learn, and succeed. If leaders show trust and respect people will be trustworthy and treat each other with respect. We adapt to our environment.
My favorite travel policy that follows this idea is:
"Travel like it’s your own money."
Summary and Outlook
You now have a visual model to answer the question: "how much process is enough?" The productivity peak is growing and moving to more process as organizations scale. Adjust every process to your team and culture. Don’t just adopt the best practice from others. Continuously improve every process and you’ll keep surfing the wave of productivity.
I started thinking about this framework in 2020, before LLMs changed how teams operate. The effect: The curve’s peak is getting higher. Today small teams can be more productive every month as models improve. The framework still holds. The question of "how much process is enough?" stays. What changes is who bears the cognitive load. The next time you review a process, ask: What steps can I automate today?
The wave just got taller. Keep surfing.